I have not updated this for months and months. First I was waiting to see the effect of vaccinations, and it was great. So I thought we are almost done with this. And then the Delta virus came in and the "herd immunity" from vaccinations went away in the face of the more infectious Delta variant. The case numbers have risen dramatically, both in the US and locally. The two bright thoughts are: (1) It is overwhelmingly the unvaccinated that are getting sick. (2) The numbers of infected people are high, but hospitalizations are still not overwhelming the hospitals except in places with very low overall vaccination rates.
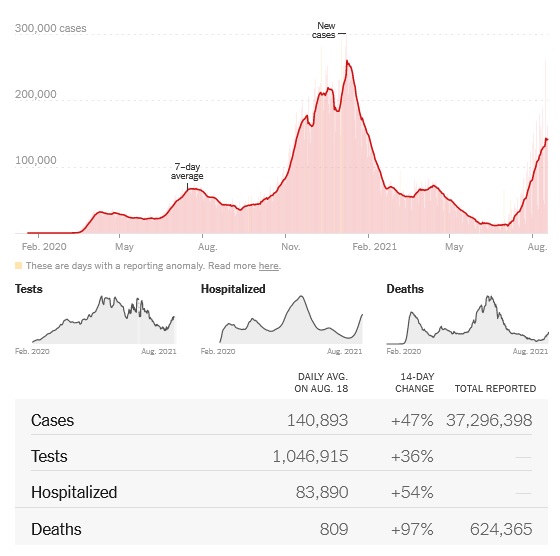
New infections per day about 140,000 - which is about 47 per 100,000 population.
| Week | New Cases | Infectious | In Hosp | In ICU | Dead/Week | New/100K |
|---|---|---|---|---|---|---|
| 08/17 | 112 | 823 | 65 | 12 | 3 | 29.4 |
| 08/10 | 86 | 563 | 37 | 7 | 3 | 20.9 |
| 08/03 | 52 | 430 | 31 | 5 | 3 | 17.0 |
| 07/27 | 53 | 342 | 17 | 3 | 2 | 13.7 |
| 07/20 | 32 | 202 | 20 | 6 | 1 | 8.1 |
| 07/13 | 16 | 97 | 11 | 3 | 1 | 3.8 |
For comparison, here are the numbers from last December:
| Week | New Cases | Infectious | In Hosp | Dead/Week | New/100K |
|---|---|---|---|---|---|
| 12/15 | 207 | 1059 | 78 | 3 | 46.0 |
| 12/8 | 125 | 700 | 50 | 2 | 27.8 |
| 12/1 | 50 | 394 | 39 | 2 | 15.1 |
While we have more sick people, the number of deaths has not gone up. This will change very quickly, if we do not have ICU beds.
So be very careful, just like last winter. Wear a mask if you are within 6 feet of people who do not live with you.
And a political commentary:

(End of page)